Contrast Sensitivity Background
Ability to Detect Subtle Shades of Gray in the Real-World
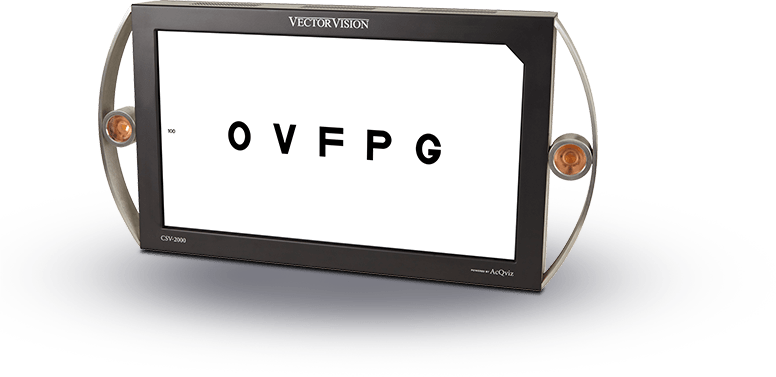
Contrast sensitivity is a person’s ability to see low contrast images in the real-world, such as a street sign on a dark roadway, a flower pot sitting on the floor of a dimly lit garage or the size of the step height for a sidewalk at night. Contrast sensitivity is unlike the visual acuity test, “Big E Chart,” which measures only how well a person can identify high contrast black-on- white letters. Using low contrast images, contrast sensitivity testing can detect subtle changes in vision that are hidden by visual acuity. Many studies show contrast sensitivity testing is useful for evaluating a wide range of patients, including patients with:
- Diabetes
- Macular Degeneration
- Cataracts
- Glaucoma
- Traumatic Brain Injury
- Amblyopia
- Optic Nerve Disorders/Multiple Sclerosis
The testing is also useful for evaluating patients treated with:
- LASIK or other types of refractive surgery
- New Technology IOLs
- New technology contact lenses
Finally, the testing is very useful in measuring the vision of patients with high visual requirements, including:
- High Performance Athletes
- Fireman
- Policeman
- Pilots
How is Contrast Sensitivity Different than Acuity?
In 1862, Dr Snellen, from Utrecht, Holland developed the Snellen visual acuity test primarily for the purposes of prescribing glasses. This Snellen Chart, “The Big E Chart,” presents a series of high contrast black-on-white letters in different sizes. Relatively small changes in refractive status can be detected by this test and it is very useful as a standard for describing changes in vision caused by spherical blur. Unfortunately, many types of vision loss are not caused by spherical blur and for these types of vision changes, e.g. cataracts, glaucoma, irregular astigmatism, etc., Snellen acuity is an inadequate measure.
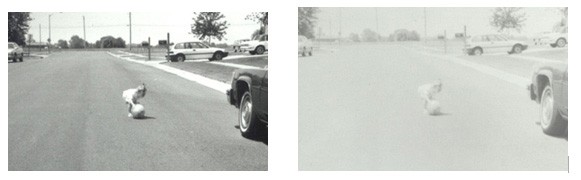
Contrast Sensitivity Measures Real-World Vision
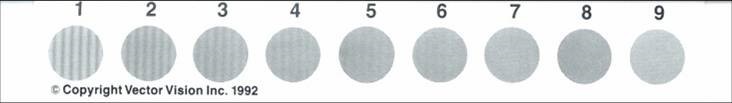
Acuity tests uses only black and white letters, but the real world consists of shades of gray. CS testing determines not only how patients can see under high contrast conditions, but also under real-world low contrast conditions. The images below show the same seen under high contrast, normal daylight type conditions, and low contrast, early morning fog or glare type of conditions.
How is Contrast Sensitivity Tested?
Normally a range of target sizes are used to test contrast sensitivity. In this way contrast sensitivity is unlike acuity. Contrast sensitivity measures two variables, size and contrast, while acuity measures only size. Contrast sensitivity is very similar to auditory testing, which determines a patient’s ability to detect the lowest level of loudness of various sound frequencies. The patient is asked to depress a button when the tone is just barely audible and release the button when the tone can no longer be heard. This procedure is used to test auditory sensitivity to a range of sound frequencies. If auditory testing were evaluated in a similar way to visual acuity, all the sound frequencies would be tested at one high level of loudness.
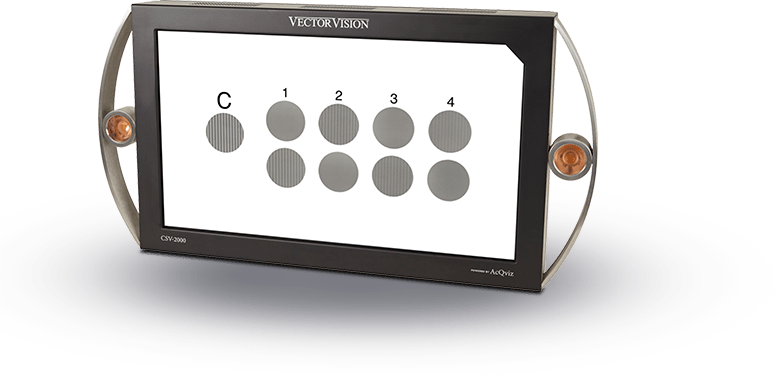
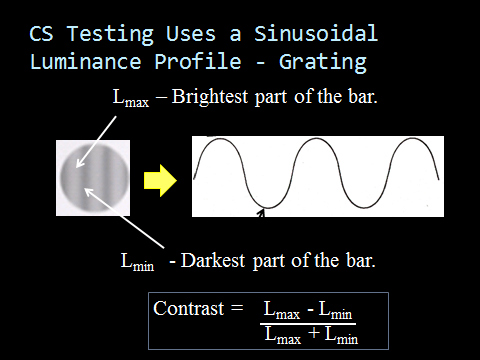
Sine-Wave Gratings are Used for Accurate Testing
A true contrast sensitivity test uses sinusoidal patterns which vary in luminance across a grating pattern (see image below). The luminance of the grating is varied from 0.5% contrast to 90% contrast. Contrast sensitivity determines the lowest contrast level which can be detected by a patient for a given size of the grating pattern. The different size gratings are called spatial frequencies.
Contrast Sensitivity is a Detection Task
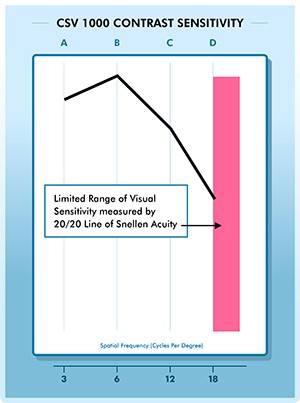 Contrast sensitivity is a detection task, much like auditory testing and perimetry (can you hear/see it or not), as opposed to an identification task like acuity (can you identify which letter it is). Detection tasks are inherently more sensitive than identification tasks and this is one of the many reasons why contrast sensitivity is much more sensitive measure of visual function than acuity. Contrast sensitivity measures a much wider range of vision than acuity (see graph showing narrow range of vision tested by 20/20 acuity vs. the full range of vision tested by contrast sensitivity.)
Think about how insensitive a hearing test would be if the patient had to identify a tone or a song, instead of just detecting a pure frequency. Or, consider of how insensitive perimetry would be if a glaucoma patient had to identify a pattern in the peripheral vision, versus simply detecting spots of light at various eccentricities.
The Contrast Sensitivity Curve
Contrast sensitivity is presented as a curve, which plots the lowest contrast level a patient can detect for a specific size target. The x-axis of the curve is for spatial frequency, while the y-axis is for contrast sensitivity. Low spatial frequencies are fat gratings and high spatial frequencies are thin gratings. Contrast sensitivity is the inverse of contrast level. The higher the contrast sensitivity, the lower the contrast level at which the patient can detect a target. The contrast of the grating is calculated as shown in the image above and contrast sensitivity is the inverse of contrast threshold. For example, if a patient can detect a grating at 1% contrast (which is called the contrast threshold), then the contrast sensitivity for this patient at that spatial frequency is 100 or the inverse of 1% (1/.01).
Plotting a Contrast Sensitivity Curve
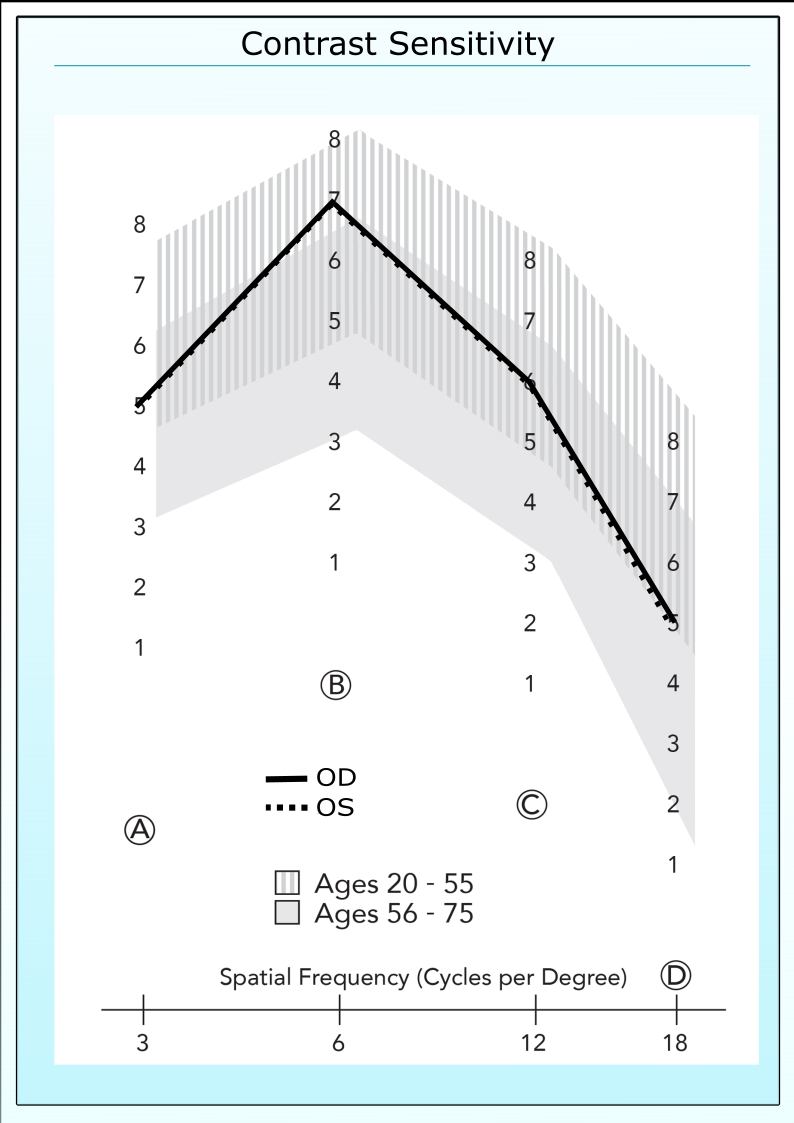 Most commercially available contrast sensitivity tests provide measures for 4 or 5 size grating patterns (spatial frequencies). Each of these spatial frequencies is presented at 8 to 10 contrast levels. To plot the curve, simply determine the highest contrast sensitivity level (or the lowest contrast threshold) a patient can detect for each spatial frequency. This curve shows an example for the results for the VectorVision contrast test for both eyes.
On row A, the highest contrast sensitivity level the patient can detect for both eyes is level 5. On row B, the highest level is 7. On row C and D the highest levels are 6 and 5, respectively. To plot the curve, check the number 5 in column A, 7 in column B, 6 in column C and 5 in column D. Connect these check marks and the result is a contrast sensitivity curve. Often results are different for each eye, and the eyes should be plotted separately.
Visit other parts of our website to determine how the contrast sensitivity results can be used to assess cataracts, glaucoma, diabetes, refractive surgery, contact lenses, and other eye conditions or optical devices.