CSV-1000 Versus Other Tests
The CSV-1000 is a direct measure of contrast sensitivity, which, by definition, is the patient contrast threshold for detection of sinusoidal grating patterns. The contrast threshold is the lowest contrast level at which a patient can detect a grating pattern of a certain size, i.e., certain spatial frequency. Testing vision using this approach has many advantages including:
- Provides a direct measure of patient threshold (not an estimate). Think about perimetry or auditory testing; these tests use a detection task to directly measure a threshold for peripheral vision or hearing. Testing with letters, while very familiar to clinicians and patients, requires an identification task. Identification is not a threshold task and provides only a probability estimate of the actual contrast detection threshold, based on a complex set of generalized mathematical calculations that may not be applicable to individual patients.
- Results provide a log value for contrast sensitivity that can be used for statistical analysis.
- Results generate a curve for vision, with a threshold for each spatial frequency, not a single number. A single number is always less sensitive for evaluating vision and may not be applicable to individual patients.
- Studies have shown direct correlations between contrast sensitivity at specific frequencies and physiological and anatomical factors. These correlations have not been demonstrated with identification-type threshold tests.
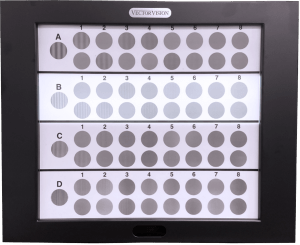
CSV-1000
Test Variability
Test variability is an important factor when determining which test to use in the clinic or in trials. A tradeoff and a balance exists between test variability and sensitivity. A test can always be made to have higher test-retest reliability and less test-retest variance, if the test sensitivity is reduced. As an example, assume an accurate measure is needed to design the size of a desk that will fit into a very defined area in a space station. If 10 engineers are asked to measure the size of the desk in microns, all ten engineers would most likely obtain different results. And, on retest, the results most likely would also be different for each engineer, i.e. high test-retest variance. However, if the engineers measured the desk size to the nearest foot or meter, with a yard/meter stick, then the test results would have perfect test-retest reliability. Unfortunately, the second test provides little sensitivity to measure small increments in size and thus has little value for this particular task.
The question to ask for sensitivity versus reliability is “What is being measured and how much discrimination is needed?” To answer this question, the coefficient of reliability (COR) should be used. COR is an important metric because it compares the change in a measured outcome, such as due to drug treatment or disease progression, against the reliability of the test used. (See: Elliott & Bullimore. Invest Ophthalmol Vis Sci 1993). The reliability has to be such that the test can detect the changes in question. On the other hand, if the test is too insensitive to measure the changes in a patient, then test-retest reliability has little value, as in the desk example above. Many authors use test-retest variance or reliability as a primary metric to determine the quality for a vision test, but these studies overlook the key factor, which is the sensitivity of the test versus what is being measured. Tests that can only detect large changes in vision, typically have higher reliability than those tests which are more sensitive. Which test to use depends on the goal of measurement, the incremental change to be detected and the test sensitivity versus the test reliability.
Important: The CSV-1000 has been evaluated using the COR to evaluate changes in contrast sensitivity related to drug treatment. This study, as well as others, have shown that the CSV-1000 has excellent reliability to detect subtle changes in contrast sensitivity induced by drug treatment (See: Pomerance et al, Invest Ophthalmol Vis Sci 1994 ). These same comparisons have not been conducted with either the Pelli Robson or AST tests.
Test Sensitivity – Detection Vs Identification Task
Pelli Robson and AST Use Identification Tasks
Most sensory measurements used in health care require a detection task, because detection tasks are inherently much more sensitive than identification tasks. For example, in audiology, the patient is asked when he or she can just detect a sound frequency. The patient is not asked to identify a tone. For perimetry, the patient is asked when he or she can just detect a spot of light, not when a symbol can be identified in the periphery. Tactile sensation works the same, the patient is asked when he or she can first feel an object, not when he or she can identify it. Both the Pelli Robson and AST use an identification task, where the patients have to identify letters. This identification requirement dramatically lowers the sensitivity of the test. The supposed advantage, as suggested in the literature, is that requiring an identification task reduces test variance. As discussed here, test variance and test sensitivity are a trade-off. Simply decreasing the test variance has little value if the test sensitivity is lowered to the extent that the goal of measurement cannot be achieved.
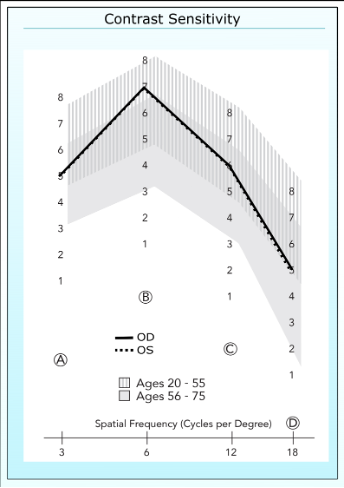
Range of vision tested by CSV-1000
CSV-1000 Vs Pelli Robson
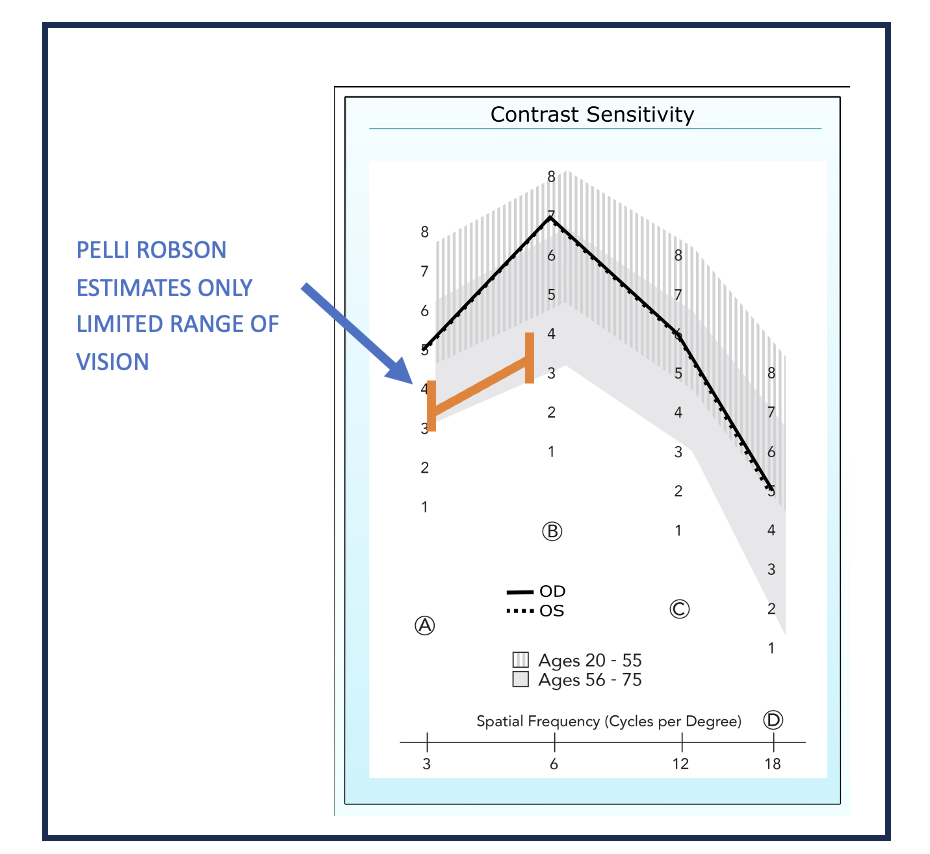
The Pelli-Robson (PR) test uses one size of very large letters. When tested at one meter, the letter projects across approximately 2.8 degrees of visual angle on the retina, which is an acuity level of 20/674. These letters are presented in sets of three, with each letter triplet presented at a different contrast level. The patient is required to identify the letters. The original article about PR, written by its developers, states that the test is an ESTIMATE of contrast sensitivity at one mid spatial frequency, between 3 and 5 cycles per degree. The authors (Eli Pelli and John Robson) also state that estimating thresholds at higher spatial frequencies is unnecessary as virtually all patients “have a stereotype form” that can be easily estimated by high contrast acuity, thus measuring these frequencies has little value in the clinic (See: Pelli et al. Clin Vision Sci 1988 ). Voluminous subsequent research shows that this assertion is incorrect as many types of vision conditions can affect the higher spatial frequencies not measured by PR, and that these differences cannot be measured or detected by high contrast acuity. Specific conditions include corneal astigmatism, diabetic retinopathy, dry eye, early AMD, glaucoma, cataracts and many others. Further, many studies have shown very high correlations between higher spatial frequencies, specifically 12 cycles per degree, and physiological and anatomical measures, such as oxygenation of the retina in diabetic patients, ocular blood flow in glaucoma patients, size of foveal avascular zone in early diabetes, correction of endothelial smoothing in refractive surgery, etc. These same correlations have not been demonstrated with the Pelli Robson test.
Best Use
The Pelli Robson should be used for studies or in the clinic where patients have poor vision (Worse than 20/100). Specifically, these patients have highly depressed vision at high spatial frequencies and, as such, measuring these frequencies provides little clinical information. When patients retain vision only across the lower spatial frequency range, then PR can provide an estimate of a contrast sensitivity threshold. These include mostly patients with low vision or highly progressed vision loss due to disease.
Not Best Use
The Pelli Robson should NOT be used for evaluating conditions where patients maintain good acuity (20/100 or better). Examples include quantifying quality of vision following refractive surgery or IOL implantation, early treatment-related changes in vision for AMD or diabetes, drug induced changes in glaucoma patients, contact lens optimization, measuring advancement of vision loss in multiple sclerosis patients, etc. In these patients, a threshold contrast sensitivity test across a full range of spatial frequencies is superior, such as the CSV-1000. Further, it is unknown whether PR can detect subtle treatment related-changes, even in patients with low vision, since the test provides only an estimate of change in contrast threshold, not a direct measure.
Other Considerations
- Cost: The Pelli Robson test has relatively low cost.
- Operational Issues: To be most accurate the PR test should be used with additional uniform lighting so that each letter triplet is tested at the same light level. Once the chart lighting is set up, no further maintenance is required, except to periodically check the light level provided by the testing light source. The Pelli Robson is also offered in a transilluminated format to be used with a back-lit light source. However, the PR trans-illuminated test has never been validated or tested against the original chart version. Further, no data on the contrast levels of the trans-illuminated test are available publicly.
Rule of Thumb
As a rule of thumb, if the patient has worse than 20/70 to 20/100 vision, PR may be very useful to estimate contrast sensitivity.
Range of Vision tested by Pelli Robson
CSV-1000 Versus AST (Advanced Sensory Technology)
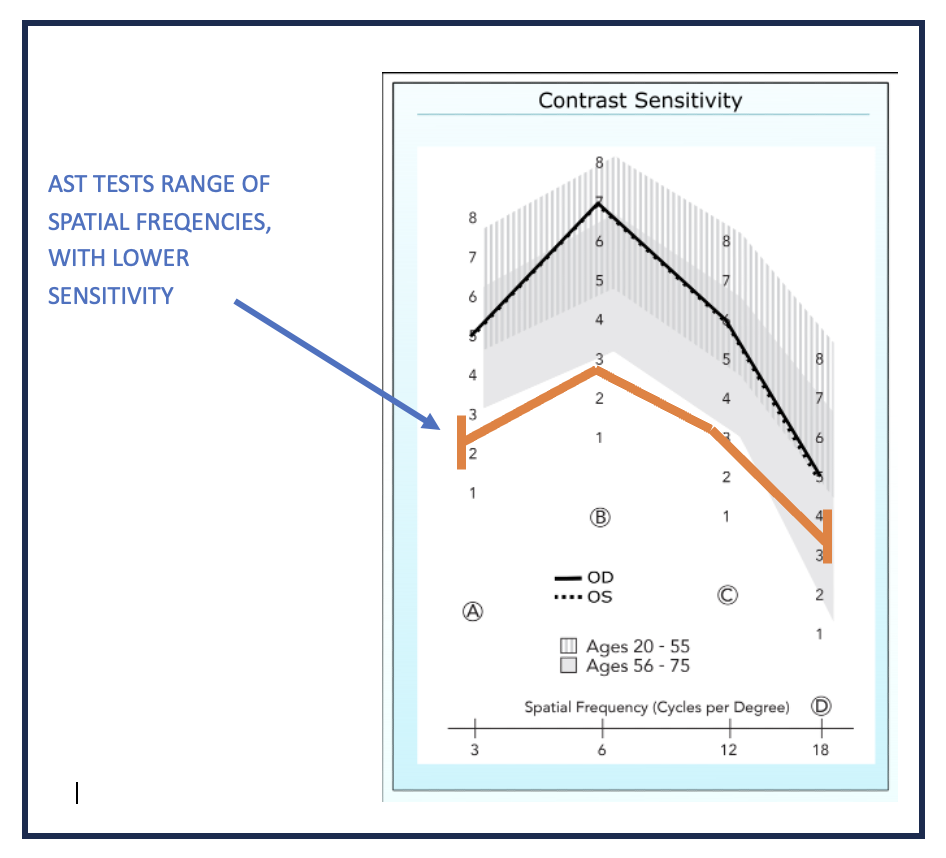
As with the Pelli-Robson, AST does not provide a direct measure of contrast sensitivity, but an estimate using letter identification, with letters presented in certain formats. In the case of AST, the test is more advanced and sophisticated than the Pelli-Robson, because it provides a measure of vision across a range of letters sizes (i.e. a range of spatial frequencies) and contrast levels. The test is based on a complex Bayesian probability model that generalizes and smooths the data to obtain the estimate. This generalization makes the test a little faster, closely approximating the rapid test time, 2 to 3 minutes per eye, of the CSV-100. Advantageously, the output does provide both an estimate of the contrast threshold for each letter size and for the overall area under the estimated contrast sensitivity curve, called the AULCSF or the Area Under Log Contrast Sensitivity Function. The AULCSF has been shown to provide useful information, and many clinicians and researchers gravitate to this measure because it provides one number for vision, similar to visual acuity. The disadvantage of AST, in addition to requiring an identification task, is that the underlying algorithm used to speed up the test, losses sensitivity when it generalizes the data. Researchers who have studied AST Vs the CSV-1000 state that …”one potential limitation to the present approach ( is AST ) is the inability to characterize subtle differences in the shape of the CSF ( i.e. contrast sensitivity function. )” (See: Thurman et al Journal of Vision 2016 ).
Best Use
AST is best used for studies where generalized differences between patient cohorts is the goal of the study and visual acuity is insensitive to these differences, such as identifying patients with vision loss in early diabetes versus those with no vision loss. As with the PR test, because it is a generalized measure of vision, it can be useful with patients with lower visual acuity wherein subtle differences in the contrast sensitivity curve are not warranted.
Not Best Use
AST should not be used to detect or measure individual differences in contrast sensitivity, such as drug-related changes or the individual progression or recovery of eye disease.
Other Considerations
- Cost: AST requires a captive computer and display system that must be acquired from the company. The Cost is much higher than the PR or the CSV-1000.
- Operational Issues: AST system requires installation and regular visits for to re-calibrate the device display luminance. One operational advantage of AST is that it tests using a automated staircase protocol which requires less technician input than the PR or CSV-1000.
Rule of Thumb
As a rule of thumb, if a patient has worse than 20/70 to 20/100 and/or generalized reduction in vision compared to the normal population, the AST has value and is more useful than Pelli Robson.
Range of Vision Tested by AST
CSV-1000
Best Use
The CSV-1000 is best used with patients who have relatively good acuity (< 20/100) and where a direct contrast threshold measure is warranted, for example where a clinician or study sponsor is evaluating a subtle change in vision due to treatment or disease progression.
Not Best Use
CSV-1000 should not be used in patients with worse than 20/100 visual acuity.
Rule of Thumb
As a rule of thumb, if the patient has relatively good acuity and the purpose of the test is to detect subtle changes or reductions in vision, CSV-1000 is the superior test.
Other Considerations
- Cost: CSV-1000 has a moderate cost with a very long life span.
- Operational Issues: The CSV-1000 provides a patented self-calibrated light source which requires no set up or ongoing calibration or maintenance.
- Population Norms: The CSV-1000 is the only contrast test which offers published population contrast sensitivity threshold normal values across different age groups. Neither Pelli Robson or AST have published population normal values.